Go to the U of M home page

Friday, December 21, 2018

School Desegregation News Roundup, Part 2: Big diversity lawsuits at Harvard and Hartford

The Institute on Metropolitan Opportunity is pleased to feature the School Desegregation News Roundup: periodic updates and reflections on educational desegregation and related issues, provided by Peter Piazza, an education policy researcher at Penn State's Center for Education and Civil Rights. Updates are crossposted on his site, available here

Last week, we posted a news roundup that focused on an anti-affirmative action case at Harvard that could have major consequences. This post is about its K-12 companion case – an anti-school integration lawsuit in Hartford that could also have major consequences. If you missed that first post, here’s the main takeaway:
In the Harvard trial, there’s an understandable concern in that Asian American students are disproportionately rated lower in “personal characteristics.” But, SFFA is using this important, yet relatively small, issue to do something very big: end race-conscious admission across all publicly funded universities in the US. Again, you’ll see a similar theme in Hartford. 
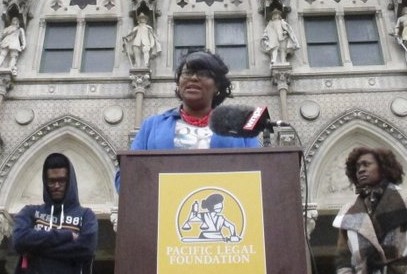
So, to Hartford, where the Pacific Legal Foundation (PLF) has mobilized a group of Black and Latinx parents to file suit against the state because their children were not admitted to highly sought after schools in the city’s magnet program. As described in part 1, PLF has been a long-time opponent of school integration, fueling the 2007 Parents Involved case (more about this below). Like the Harvard case, this one represents a relatively new legal strategy in which opponents of race-conscious policy – like PLF and Ed Blum – mobilize non-white plaintiffs in cases that ultimately work against school diversity. 
LaShawn Robinson at the Connecticut capital building
(via the Associated Press)
  • Jurisdiction: This part can be confusing. PLF filed suit in a federal court, which puts it in the pipeline towards SCOTUS. However, the key school integration case that applies to CT schools (Sheff v. O’Neill) is a state level case. The Sheff case, decided in 1996, required Hartford to address racial isolation in city schools, leading to the very magnet program that is at stake in Robinson. So, supporters of Sheff are arguing that the Robinson case should be dismissed. There are two key parts of their argument:
    • The state of Connecticut, the defendant in Robinson, never wanted to integrate schools; so, it’s not going to put together a vigorous self-defense in a federal case.
    • There’s a state court hearing scheduled for Feb 2019 to talk about fixes to the Sheff ruling. Integration supporters claim that this is the best way to address the problems raised by Robinson plaintiffs, not a federal trial. A federal judge is currently deciding the jurisdiction for the case, and that decision is expected soon.
  • Plaintiffs: A group of seven parents who are filing on behalf of themselves and their children. LaShawn Robinson is the named plaintiff (pictured above). This article has interesting background about her and about the case in general. And, this blog post – a passionate defense of the case – was written by a friend of one of the plaintiffs.
  • Key claims-
    • Plaintiffs: As defined in Sheff, an “integrated school” in the magnet system has between 25% and 75% students that are not Black or Latinx (called “reduced-isolation students”). Students are assigned to schools based on a lottery, and plaintiffs are parents of Black and Latinx students who did not get their schools of choice in the lottery. As described in this very helpful article:
      • “The plaintiffs argue that the 25% “reduced-isolation student” benchmark is actually an enforceable quota, that the lottery is weighted to account for a student’s race, and that Hartford-area magnet schools are literally reserving 25% of the seats in their school exclusively for students who are not black or Hispanic, thereby creating an impermissible racial classification.” Like the Harvard case, plaintiffs are arguing there’s a kind of backdoor quota.
    • Defendants: This is a really important point – the lottery used to assign students to schools does not include race. As pointed out here, “there was no place on the 2017-2018 lottery application form for an applicant to list their race.” This is the key argument from defendants. Instead of race, the lottery is based on things like home address, school preferences, and where their siblings go to school. After the lottery, if school enrollments fall outside the 25%-75% band mentioned above, schools are at risk of losing some state funding.  
  • At issue: So, the Harvard trial largely centers on the use of the “personal characteristics” score, and the Hartford trial centers on what, exactly, is in the lottery and on how the lottery is used. As described here, plaintiffs “allege that the lottery is re-run until the right percentages of student race are achieved and that the Sheff benchmarks for identifying an integrated school are actually unyielding racial quotas which leave classroom seats empty unless they can be filled by reduced-isolation students.”
  • Left out: Another key part of the defendants’ argument – Connecticut has refused to fully fund the magnet schools program in recent years. As you may remember, CT faced another major court case recently – after a state judge required a complete overhaul to the state’s school funding system, the state supreme court overruled the lower court, leaving the status quo in place. As described by that lower court judge, funding in CT is inequitable and “irrational.” Of course, this affects Hartford’s magnet schools. Defendants argue that this (along with other fixes) should be the focus of any changes to Sheff.
  • At stake: There are two big issues here- race as a compelling interest in K-12 school enrollment and charter school expansion.
    • This case could end up being a sort of relitigation of the 2007 Parents Involved decision. Although it’s widely believed that Parents Involved actually ended race-conscious K-12 enrollment, this is a misread of the case. Justice Kennedy actually agreed with the liberal justices that “diversity . . . is a compelling educational goal a school district may pursue,” and that includes “avoiding racial isolation.” But, he then sides with the conservative justices in striking down the Louisville and Seattle plans, not because of the fact that they used racial classifications, but because of how they used race (not narrow enough, in his opinion). This article has a great breakdown/analysis of the case. As a result, states and districts actually have a lot more legal grounds for voluntary race-conscious integration than is widely believed. PLF was behind Parents Involved, and they just narrowly missed their goal. Robinson is their second chance.
    • PLF is also a big supporter of charter schools, including those managed by for-profit groups. However, charter growth has been slower in Hartford, compared to other CT cities, largely because of the magnet schools program. By clearing the desegregation order from Sheff, PLC paves the way for charter operators that use “colorblind” approaches to school enrollment. Not coincidentally, “nearly all of the publicly-funded, privately-managed charter schools in Connecticut are racially segregated.”
  • Key articles:
  • I relied heavily on this article in the summary above, and I highly encourage a full read. This article is also extremely useful. These are two of the most thoughtful and detailed articles that I’ve found so far on this case.
    • This blog post also contains a useful breakdown of the case, while going into more detail about PLF’s potential interest in charter expansion.
    • Lastly, this op-ed was co-written by Elizabeth Sheff herself. Now long removed from her case, she notes the academic benefits of school integration before reflecting that:
“The progress achieved through Sheff consists of far more than just high graduation rates and improved test scores. When students have a chance to learn alongside kids who come from different racial and economic backgrounds, it broadens their perspectives, making them more comfortable with a variety of people and cultures. In our democracy — where different racial groups are not always provided opportunities to interact with one another — an integrated school is a crucial experience that every child should have access to.”
Yeah – it’s a big deal. And, it’s unfortunate (to say the least) that groups like Students for Fair Admissions (the Harvard case) and PLF are exploiting fixable problems and legitimate concerns of non-white students/families as excuses for completely undermining systems put in place to balance the opportunities offered to Black and Latinx students against the enormous social/political opportunities that have been enjoyed by white families (especially wealthy white families) since forever. I’ll track each case and post updates.

Friday, December 14, 2018

Redlining in the Twin Cities in 1934: 1960's and Today


IMO has released a story map series that covers the history of housing discrimination and civil rights in the Twin Cities.  Historical persons and places are depicted on the 1934 Home Owners’ Loan Corporation map, which based its categories on race and was used to justify disinvesting in segregated minority communities. Over eighty years later, the patterns on this historic government-sanctioned ‘redlining’ map closely resemble today’s concentrations of communities of color in the cities of Minneapolis and Saint Paul, reflecting current inequality in terms of transportation, affordable housing and mortgage lending.

The series calls attention to the history of white hostility towards racial minorities in the Twin Cities. It highlights local civil rights activism, that later gained national prominence, and demonstrates how past and current policies perpetuate segregated living patterns in the Twin Cities. 

Link to story map below:


Wednesday, December 12, 2018

School Desegregation News Roundup, Part 1: Big diversity lawsuits at Harvard and Hartford

The Institute on Metropolitan Opportunity is pleased to feature the School Desegregation News Roundup: periodic updates and reflections on educational desegregation and related issues, provided by Peter Piazza, an education policy researcher at Penn State's Center for Education and Civil Rights. Updates are crossposted on his site, available here

November was a busy month for school diversity and civil rights news. In the interest of space, I had to leave out stories on a failed (and bizarre) white secession attempt near Atlanta, new research/reporting on “a la carte” living (or, when neighborhoods become more diverse, but schools do not), and Cindy Hyde-Smith and segregation academies. (I haven’t been able to bring myself to write about that last issue, but Noliwe Rooks has a great piece about it in the NY Times.) Meanwhile, I wish I had more space to write about the proposed revision to sexual assault investigations from the DeVos DOE, but these articles have good overviews on implications for K-12 and higher education. This will be a topic for a future post. 
Instead, I want to focus on lawsuits that majorly threaten diversity at the K-12 and higher ed levels. Specifically:
  • Students for Fair Admission (SFFA) v. Harvard, a federal case that could potentially end race-conscious admission policies at the higher ed level; and
  • Robinson v. Wentzel, a federal case centered on Hartford, CT’s magnet school program that could potentially end race-conscious enrollment policies at the K-12 level.
As you can tell, there are important similarities here, especially that there are high stakes consequences for each trial. But there’s more:
  • Historically, affirmative action/integration opponents have used cases of white people denied admission to K-12 or high education to chip away at race-conscious policymaking. The Harvard and Hartford cases represent a new legal strategy: using non-white students/families as plaintiffs in cases that work against school diversity.
  • Both complaints were financed by high-profile anti-integration legal groups.
  • Both lawsuits were filed in federal court, putting them on track for a potential SCOTUS ruling, which would likely lead to the worst for affirmative action/integration supporters. As I explain in part 2, the pipeline for the Hartford case is a little more complicated.
Since I had a lot to say about each case, this post is split into two parts, with this one focusing on the Harvard case and a post tomorrow for Hartford. In each post, I use the new coverage to highlight a few key points, and I link to useful articles/resources for those who want to learn more about each case. On to the Harvard case!
Edward Blum (from The Atlantic)
  • Jurisdiction: Currently in a federal court – Hearings were held Oct 15-Nov 2, and the judge recently ordered a new round of hearings scheduled for Feb 13.
  • Plaintiffs: An anonymous group of Asian American students, represented by Edward Blum/SFFA
  • Key claims:
    • Plaintiffs: “SFFA argues that Harvard, and ultimately all colleges, should no longer consider race in its admissions process, and that Supreme Court rulings in support of affirmative action have ‘been built on mistakes of fact and law.’”
    • Defendants: “The university argues that its “holistic” admissions process is necessary to ensure a diverse student body and does not discriminate against Asian-American students.” Many students apply to Harvard with perfect GPAs and/or SAT scores; so, the university needs to use other criteria, which brings us to a core issue of the SFFA compliant.
  • At issue: In addition traditional measures, Harvard uses criteria like participation in extracurriculars, volunteer work, legacy status and a “personal characteristics” rating (among other criteria). As reported in this very helpful Vox.com story, “internal data shows Asian-American applicants are rated lower on personal metrics, despite outperforming white applicants in other areas.” As a result, SFFA argues that Harvard is effectively using the personal characteristics rating as a sort of backdoor way of enforcing a racial quota.
  • Left out: The same internal report from Harvard showed that “legacy” admissions offer an advantage to wealthy, white applications; however, this form of affirmative action is not part of the SFFA’s complaint and thus is not threatened by the case.
  • At stake: This case could ride the appeals process up to the Supreme Court, where the results (unlikely to be positive for integration advocates) would almost definitely apply to all publicly funded universities in the US, basically ending affirmative action as we know it. This article makes an interesting point – if SFFA loses the federal case, it will definitely appeal; but, if Harvard loses, it could decide not to appeal, thereby keeping it out of an inhospitable court.
  • Additional useful/interesting links:
In the Harvard trial, there’s an understandable concern in that Asian American students disproportionately receive lower ratings in the “personal characteristics” category. But SFFA is using this important, yet relatively limited, issue to do something with far-reaching implications: end race-conscious admission across all publicly funded universities in the US. Again, you’ll see a similar theme in Hartford.

Wednesday, November 21, 2018

Racial Diversity and 2018 Minnesota General Election

In previous IMO posts we found that 2018 voting results in the Twin Cities metropolitan area helped propel Democratic candidates to win statewide races and state legislative seats, especially gaining in the fully developed suburbs. Turnout was high across the state, particularly with women and on the edge of Twin Cities developed suburbs, but comparably lagged in rural Outstate Minnesota.

While hostility towards immigration and increasing diversity are among factors linked to election results, some of the largest increases in the Democratic vote occurred in racially diverse and semi-diverse suburbs in the Twin Cities metro, municipalities with populations between 10 to 30 percent non-white.

Racial and Voting Compositions in Minnesota Municipalities

In 2016, racial minorities make up 19% of the total population statewide. Minnesota’s population more typically lives in municipalities that are racially diverse, with racial minorities making up 15% to 29% of their population. The chart below shows the total share of population broken out by percentage minorities in municipalities. The left set of bars shows that statewide 30% of Minnesotans live in diverse municipalities, while only 17% live in more exclusively white municipalities that are less than 5% minority.

There are clear difference between municipalities in the Twin Cities metro and Outstate Minnesota, with the metro having more racial diversity overall.   The middle set of the chart's bars below shows the population shares by minority percentage in municipalities for Outstate Minnesota and the right set shows these shares for the Twin Cities 11-county metro area. In the metro, 37% of residents live in diverse municipalities, while only 20% do outstate. A greater difference between the metro and outstate is that the share of municipalities with 30% or more racial minority, is large in the metro (31%) and quite small outstate (4%).

Racial diversity generally favors Democrats in elections. Typically, the larger the percentage of racial minorities that live in municipalities, the greater the percentage of voters that choose Democrats, as shown on the chart below for the 2018 Governor’s race. The chart shows this trend is pretty consistent statewide and in the metro, but is a little less apparent outstate.  Although we report solely on the governor’s election, similar dynamics can be found in other 2018 election contests.

In Outstate Minnesota the Democratic vote shares in predominately white municipalities (< 15% minority) is actually slightly higher than in the metro, while the converse is true in more racially diverse municipalities, where the metro has much larger shares of the Democratic vote than outstate. In terms of the total vote, the fact that predominately white outstate locations tend to vote slightly more Democratic than similar metro locations is outweighed by the fact that these locations still less often vote Democratic and make up over three-quarters of the outstate population, compared to only one-third of the metro’s total population.


Change in Racial and Voting Compositions

Statewide, population percentage growth is moderate and relatively uniform across diverse and semi-diverse municipalities, but changes in population lagged or declined across predominately white municipalities. Furthermore, by far, growth was higher in the Twin Cities than it was in Outstate Minnesota, regardless of the racial composition of municipalities, as shown on the chart below.  

While population tended to grow slowly or decline outstate, and grow faster in the metro, racial minority shares in municipalities tended to grow more outstate than in the metro, as shown in the chart below. In Outstate Minnesota, municipalities with 30 to 39% minority had the highest increase in minority shares, a 5.0 percentage point increase, locations that tended to vote Republican (as shown on the 2nd to top chart), followed by municipalities with 40% or more minority, which had a 4.2 point increase. In these locations, the increase in minority shares is explained, in part, by lagging and declining white population change.

In the Twin Cities metro, municipalities with 40% or more minority had the largest minority share increase of 3.4 points, followed by municipalities with 15 to 29% minority, with a 2.5 point increase.

In the whitest municipalities with less than 5% minority, racial minority populations decreased statewide, outstate and in the Twin Cities metro. 

There are also wide differences between the Twin Cities metro and Outstate Minnesota when it comes to changes in the Democrat vote in the 2010 and 2018 the gubernatorial elections. The metro area Democratic vote rose across municipalities, while in outstate it declined, except in municipalities 10 to 29% minority, as shown in the chart below. 

The greatest increase in the Democratic vote occurred in racially diverse and semi-diverse Twin Cities’ suburbs (10 to 29% minority), with around an 11 point increase in the share of the Democratic vote for Governor. The greatest decrease in the Democratic vote occurred in the whitest outstate municipalities, with less than 5% minority, where the Democratic vote for Governor dropped 4.5 points.


Twin Cities Racial and Voting Compositions

The Twin Cities metro is growing, has increasing diversity and the largest share of racially diverse suburbs, and has the largest swing in the Democratic vote in the state's latest election. As shown on the map below, the central cities and first-ring suburbs voted strongly for Democrat Tim Walz, who captured over 60% of the (two-party) vote in these areas, as well as in a few second ring suburbs, including Bloomington, Eagan and Minnetonka. Walz also won almost all second ring suburbs and about half of the third ring suburbs, but did less well in outer ring suburbs and exurban (rural) municipalities, as did most democratic candidates.

Much of the outer bands of suburbs captured by Walz are racially diverse and have had recent growth in both population and racial minorities, as is shown by comparing the two maps below and charts above. Both the cities of Minneapolis and Saint Paul, as well as several inner ring suburbs have even greater racial diversity, while beyond the third ring of suburbs, municipalities are predominately white, and largely undeveloped.
The relationship between metro area racial diversity and democratic voting is better illustrated by a graph. It is clear that there is a strong positive correlation between the percentage minority and the percentage voting Democratic in municipalities, as shown on the chart below. As the percentage of racial minorities rises across municipalities, so does the percentage voting democratic in the 2018 gubernatorial election, in a curvilinear fashion.  According to this model, a municipality typically starts voting Democratic when it has a population that is 13% minority.  


One misleading feature of the chart below is that it does not account for the voting population size of municipalities. When doing so, it is clear that the Twin Cities is even more Democratic than might first appear, as most of the larger suburbs, including the cities of Minneapolis and Saint Paul, fall above 50% Democratic voting line.

Twin Cities: Changes in Five Election Cycles  

How much more the Twin Cities metro has become Democratic can be seen below in the animated map of percentage voting Democratic. In the last five election races, either presidential or gubernatorial, the area that Democratic candidates have won has, for the most part, consecutively expanded across metropolitan space. 

In 2010, Democratic Governor Dayton’s strongest support (>=60% of vote) came mainly from the central cities and a handful of first-ring suburbs, winning few of the second ring suburbs, while in 2018, Democratic Governor Walz, has moderate to strong support in most second ring suburbs, locations that Dayton largely lost in 2010.


There is also a consistent positive correlation between metro area racial diversity and democratic voting across the five elections, with some fluctuation of the overall share voting Democratic and discrepancy when the typical municipality begins to start voting Democratic. 

All elections were won by Democrats, at varying margins of victory. In 2010 Governor Dayton won by somewhat smaller margins in the metro, and he tended to win in a municipality when it was 29% or more minority. In the next election, Obama gained an even greater share of the vote, typically winning municipalities with 14% or more minority. 

In 2014 and 2016 the Democratic municipal win margins and the minority percentage shares both dropped and it became harder for a Democrat to win in municipalities with under 20% minority. And up to the present election, Governor Walz typically won municipalities with 13% or more minority (and won all but one municipality with over 20% minority).


Wednesday, November 14, 2018

Turnout in the 2018 Minnesota General Election

Following reporting about Minnesota's 2018 general election, including postings on statewide races and state representative races, today the IMO blog continues its coverage, looking into voter turnout, which was historically high for a midterm election. Turnout rates were highest in the Twin Cities metro and for women across the state, together significantly helping Democrats gain victories in races across statewide offices. 

Election Turnout Trends

A common occurrence with election cycles is that the percentage of residents turning out to vote dips during midterm elections. This decline in turnout, however, did not happen at the same level in the 2018 election, as it did in previous midterms in 2010 and 2014, as shown in the chart below.  Places across Minnesota had higher turnout, with some locations outpacing others in gaining votes.

In 2018, the Twin Cities suburbs had the highest turnout rates in the state, nearly 65%, a rate much higher than in the prior two midterm elections. The combined cities of Minneapolis and Saint Paul had the next highest rate, about 58%, slightly surpassing the overall Outstate vote for the first time since 2008 when Obama first was elected as U.S. President. 


Turnout in Outstate Minnesota was much lower than in the Twin Cities suburbs, equally lower in both the cities of Duluth, Rochester and St. Cloud and in the remaining Outstate area. This was unlike the other midterm elections, when these central cities lagged the rest of Outstate by 5 to 10 percentage points

The turnout rate was calculated taking the total number of votes for president and total votes for governor (during the midterm) divided into the number of persons age 18 and over.  
The Twin Cities suburbs includes municipalities from Anoka, Carver, Dakota, Hennepin, Ramsey, Scott Washington and Wright Counties, and does not include Chisago and Isanti Counties because their data was not reported in the sample data.
Data is from the Minnesota Secretary of State and U.S. Census Bureau, American Community Survey 1 year sample data.

The chart below better shows the differences in the magnitude of change between 2018 and the prior two elections. The cities of Minneapolis and St. Paul had the largest increase in voter turnout from the last midterm, an increase of 17.3 percentage points in the turnout rate from 2014. The Twin Cities suburbs and the other Outstate central cities also had double digit increases in the turnout rate, while the rest of Outstate Minnesota had a significant increase, but one that was comparably smaller than other locations--about half that of the cities of Minneapolis and St. Paul.

As is typical between a presidential and midterm election, turnout rates dropped between 2016 and 2018, but fell far less than usual, as shown on the chart above.  As shown on the chart below, the cities of Minneapolis and Saint Paul had the smallest drop off, only -5.8 points, followed by the Twin Cities suburbs (-8.8) and other central cities (-7.9). The drop in the turnout rate was largest in the non-central city portion of Outstate Minnesota (-10.6).

Election Turnout Geography

The map below shows the percentage of the voting age population that cast a ballot for governor in 2018 by Minnesota municipalities. Such turnout was high across the state with clusters of very high turnout (rates of 80 percent or more) scattered across the state. The county inset on the map shows that turnout was somewhat greater in Northeast, North Central, West and Southeast Minnesota. More important to the accumulation of votes, is the cluster of high turnout municipalities in the more populous 11-county Twin Cities metro area. As shown on the map's charts, turnout was significantly higher in the Twin Cities (62.7%) than in Outstate Minnesota (57.2%).
Click to view pdf version of map

In the Twin Cities' metro, turnout was above average in most municipalities throughout the area, but was consistently high (rates of 70% or more) in outer ring suburbs near the edge of the built up urban area, except on the north edge of the metro. Many first and second ring suburbs also had high turnout rates, with first-ring Edina and Mendota Heights having rates in excess of 80%. 

While Minneapolis' turnout rate was higher than average, and St. Paul's was lower than average, as shown on the map above, there are major differences in turnout when breaking the cities out by state legislative districts, as does the map below. Here turnout rates were high in more affluent districts in South Minneapolis and in Southwest St. Paul, but were lower in North and South Central (Phillips) Minneapolis, as well as in the North End and East Side of St. Paul, places with greater concentrations of racial minorities and poverty. Turnout rates also tended to be lower in inner-ring suburbs adjacent to low turnout city districts, most notably Brooklyn Center.
Click to view pdf version of map

How much did turnout change the results of the 2018 Election?

Changes in midterm voter turnout patterns (2014-2018) between Minnesota locations did benefit Democrats. Calculated from the data above, Democrats in statewide races gained 1 to 2 percentage points in the share of total votes, more than they would have if the 2014 turnout rates prevailed in 2018.  This figure is based on voters turning out across municipalities at the same rate as they did in 2014 and with shares of voting across parties kept the same as in 2018.

Who turned out to vote also impacted the election, and in this regard, women led the way in helping the Democrats gain victories, while demographics such as age and income had less of an impact in the statewide racesDemocrats in statewide races gained around an additional percentage point of the total share of the vote, more than they would have if the total vote share for women remained the same as 2014's, and if women's vote share across parties in 2018 was held constant.


Data used to calculate the share of women voting comes from NBC exit polls for Minnesota in 2014 and 2018. The chart below shows the results for the U.S. Senate seat formerly held by Democrat Al Franken, and in it the percentage share of the total vote by gender (columns) and the percentage of votes for parties by men and women in the last two midterm elections (column sections).  


The share of of the total vote by women climbed from 51% in 2014 to 54% in 2018. Just as important, the share of women voting for Democrats rose from 58% to 61%. A large part of the gain was due to the increase of 'Independent' women voters who gained a 3 percentage point share of the total vote between 2014 and 2018, and whose Democratic voting percentage was 60%--a full 10 percentage points higher than it was in 2014. 


Similar demographic trends found in this U.S. Senate special election race can be found in the State Governor and U.S. Senate (Klobachar's seat) elections, with women increasing in the share of the total votes and increasingly voting Democratic. 

While changes in turnout between locations and genders helps explain roughly one-third of the Democratic margins of victory in 2018, it is notable that voters tended to more often cast ballots for Democrats in statewide elections than they did in the last midterm, regardless of their location or their demographic profiles.