The study categorizes all US census tracts by the changes they underwent between 2000 and 2016. The report develops and utilizes a four-dimensional model of neighborhood change, which differentiates between overall growth, low-income displacement, low-income concentration, or abandonment. This spectrum of neighborhood change was devised to solve a problem faced by some other studies: the tendency to analyze neighborhood decline or gentrification in isolation, and in the process ignore the relative prevalence of each. As a result, while researchers could suggest a particular area was gentrifying or declining, it was difficult to resolve debates about which type of change was a bigger problem, and where.
Our new study also corrects a major shortcoming of some prior research into neighborhood change, which is the tendency to artificially omit many geographic areas from analysis, either because they are initially deemed "ungentrifiable" or because they fall outside central city borders. Housing markets and population flows do not stop at city borders, and middle-class areas as well as poor areas are constantly facing pressure to change. By considering all tracts eligible for change regardless of location or jurisdiction, we hope our study can provide the holistic view some previous efforts have lacked.
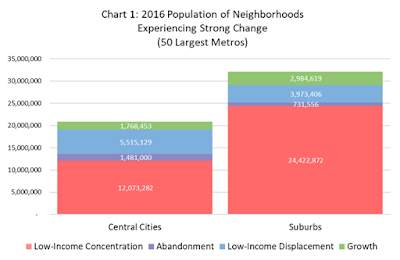
Chart 1, from the report, neatly summarizes those holistic findings (click to enlarge):
As the chart suggests, the study reveals that dramatically more Americans live in areas experiencing low-income concentration than any other form of neighborhood change--and most of those residents live in the suburbs. Low-income displacement, a hallmark of gentrification, is the next most common type of change. A relatively small number of people live in areas experiencing outright abandonment across the income spectrum, although these areas represent some of the most trouble neighborhoods in America.
Other findings from the 50 largest metropolitan areas include:
- At the metropolitan level, low-income residents are invariably exposed to neighborhood decline more than gentrification. As of 2016, there was no metropolitan region in the nation where a low-income person was more likely to live in an economically expanding neighborhood than an economically declining neighborhood.
- Low-income displacement is the predominant trend in a limited set of central cities, primarily located on the eastern and western coasts. Los Angeles and Washington, D.C. have the most widespread displacement.
- On net, far fewer low-income residents are affected by displacement than concentration. Since 2000, the low-income population of economically expanding areas has fallen by 464,000, while the low-income population of economically declining areas has grown 5,369,000.
- White flight corresponds strongly with neighborhood change. Between 2000 and 2016, the white population of economically expanding areas grew by 44 percent. In declining areas, white population fell by 22 percent over the same span.
- Nonwhite residents are far more likely to live in economically declining areas. In 2016, nearly 35 percent of black residents lived in economically declining areas, while 9 percent lived in economically expanding areas.
Table 3 from the report, below, shows the population exposure to different kinds of neighborhood change across different metropolitan areas (click to enlarge):
As the table suggests, low-income concentration is commonplace in most metros and the overwhelming trend in many. Declining industrial regions like Detroit or Cleveland the show largest amount of concentration. By contrast, only a few regions have a larger share of overall population living in areas with growth or low-income displacement than in areas with decline.
These findings only scrape the surface of the study. The full study includes a plethora of resources for analyzing neighborhood change, designed to be easily interpreted by policymakers and residents alike. These include an interactive national map of low-income displacement and concentration, detailed tabulations of the effects of neighborhood change on over 20 demographic subgroups, and individual reports tabulating and mapping types of neighborhood change for each of the 50 largest metropolitan areas. We're particularly proud of these regional maps, which we feel are highly informative and easy to read.
We'll be writing up many of the report's other findings over the coming days and weeks, but for now, we'd love for you to peruse the these findings yourself at https://www.law.umn.edu/institute-metropolitan-opportunity/gentrification.


