Go to the U of M home page

Monday, August 8, 2022

New research shows 'Choice is Yours' students have better performance results

In a NEW Minn-LInK brief, IMO research into a Minneapolis school mobility program called the Choice is Yours (CIY) found more favorable results for student participants than prior research. CIY students who took tests at least a full year after participating in the program had significantly higher math scores than non-CIY students. The same group of later-year students, however, had reading scores that were not significantly different from non-CIY students.

Notably these results, and those from prior studies, likely understate the successfulness of the program, due to their lack of controlling for prior schools attended and by not considering differences in the availability of school support services. Future research needs to better account for these factors and the full trajectory of student performance over time when evaluating school mobility programs.

Click below to link with research study brief:

Thursday, March 5, 2020

Mapping the 2020 Minnesota primary results

Minnesota's presidential primary was held March 3rd on ‘Super Tuesday’, which was contested by Democratic candidates and in every practical sense, uncontested for Republican incumbent Donald Trump. A big surprise was Democratic candidate Joe Biden receiving the largest share of votes (38.6%), even though an earlier poll found him at a distant 4th place.

Biden’s vote share was followed by Bernie Sanders (29.9%), Elizabeth Warren (15.4%), Mike Bloomberg (8.3%) and Amy Klobuchar (5.6%). Klobuchar dropped out of the race a day before the election, giving her endorsement to Biden amid a slow showing in other states and criticism by Black Lives Matter and LGBTQ leaders for her past actions relating to civil rights issues. Being the former state frontrunner, Klobuchar's endorsement of Biden undoubtedly fueled his stronger performance in the state.

The Leading Candidates

As the below maps show, Biden gained large vote shares throughout the state, including in rural areas and middle and outer suburban areas in the Twin Cities metro, places where Klobuchar gained a foothold in the 2018 General Election.

Sanders and Warren’s vote gains were strongest in Minneapolis and Saint Paul, with Sanders also gaining large shares of votes in precincts near Indian Reservations in the state. Bloomberg, who has since also dropped out, tended to have larger vote shares scattered in outstate precincts. Of the 27 precincts where he gained over 30% of the vote, none were in the 11-county metro area.

And although Klobuchar dropped out the race before the election, she still gained large shares of votes in rural areas, often in precincts adjacent to where Biden gained large vote shares. Beyond those locations there were insufficient numbers of persons voting for Democratic candidates—rural precincts that were strongly Republican in the last general election.


The primary results suggest that the metro-outstate divide appears to be widening even more. A significant fact is that nearly three-quarters of the votes for Democratic candidates (73%) came from precincts in the 11-county metro area (544,334 of 744,291 of the votes). By comparison, in the last (gubernatorial) primary in 2018, 69% of the vote for Democratic candidates came from the metro.


Party Ideology

It is hard to discern a general pattern about how the results reflect the ideological makeup of voters, due to the large number of candidates in the primary race, among other measurement and validity issues. Although an imperfect method, by grouping progressive-leaning and moderate-leaning candidates according to their perceived ideologies, we can show a clearer pattern of where voters selected such candidates.

The below maps show that progressive candidates performed best in the cities of Minneapolis and Saint Paul (36% of all of their votes came from these cities) while moderate candidates had better results in Outstate Minnesota, outside of highly populated municipalities, and scattered across several outer suburban jurisdictions in the Twin Cities metro. 

These results suggest that the fight over the ideological viewpoint of the Democratic Party is occurring mostly in inner and middle ring suburbs in the Twin Cities, and to some extent in smaller outstate Minnesota cities.


Growth and Decline of Democratic Primary Votes

There have also been changing vote patterns over the last two primary elections, following a 2018 general election where turnout rates were high across the state, and historically high for the state’s central cities, which surpassed rural turnout rates for the first time in 20 years. 

Although data is not available to calculate turnout rates for the state’s precincts, we are able to map out percentage changes in the number of votes cast for democratic candidates over the last two elections: the 2018 gubernatorial primary and the 2020 presidential primary. We did not make comparisons to the last presidential primary in 2016, because votes were made in the party’s caucus system that year rather than the state’s primary system, as is done now in 2020. Incidentally the 2016 caucus gained only 28% of the votes counted in this year’s primary.

When comparing the voting change between the last two Democratic primaries, there are clear spatial patterns in the growth and decline of votes submitted between the primaries. Growth rates are highest in the Twin Cities particularly in growing outer suburban areas, but also in many central city and first-and second-ring suburbs.  

The fact that the current 2020 primary is for a presidential election, while the 2018 election was non-presidential makes it somewhat unsurprising that there are growing numbers of persons casting a vote in precincts for the current primary—an overall growth rate of 27.6% since 2018.

What is more surprising is that Outstate precincts are about as likely to have declining rates of votes for the Democratic primary as they are to have growing rates. Could this be an indication of further declining support for Democratic candidates outstate? It is notable that there are several exceptions to this, with strong growth in the Democratic vote rates in and around the Rochester area in Southeastern Minnesota, in Northwestern Minnesota around Moorhead and in Becker and Beltrami counties as well in the Duluth area.


Candidate Vote Results in Growing and Declining Precincts

The location where the candidates draw votes could have implications for how well they fare in a general election. While moderates gained more votes than progressives statewide, they narrowly won in the metro area, where progressive candidates performed more strongly. Yet if a progressive candidate is to win the general election they would clearly need to gain more support outside of their base in the central cities. 

On the other hand, moderate candidates should not ignore the fact that in the last general election central cities had turnout rates only outmatched by Twin Cities’ suburban areas. Furthermore, progressive candidates received larger shares of their votes from precincts that had the largest increases in votes for the Democratic primary. The chart below shows that moderate candidates Klobuchar, Bloomberg and Biden tended to fare worse in gaining votes from precincts with primary growth rates of 15% or more than their progressive counterparts, Sanders and Warren. 


On the Road to November

Diverse inner and middle-ring suburbs are places where the Democratic Party is competing the most to determine its ideological viewpoint and where many general election races have been settled with Republican candidates over the last decade. Whether there is an ideological split in the party that hampers success in the general election remains to be seen. In the last election, both moderate and progressive candidates won at the state-level, although progressives like Keith Ellison won by smaller margins. 

Another concern for the party is the emerging urban and rural divide that appears to be further widening in the latest primary. Yet again there are some positive outstate results for Democrats from this primary, which showed large growth rates in the Democratic vote in Southeastern and Northwestern Minnesota, as well as in the Duluth area. 

While the presidential primary was largely uncontested for Donald Trump, Republican candidates can look favorably toward the decline in the Democratic vote across large sections of outstate Minnesota, while looking less favorably at gains in the Democratic vote across the developed portion of the large and growing Twin Cities metro area.


Thursday, January 30, 2020

Response to “Research shows progressive places, like Minneapolis, have the worst achievement gaps.”

On January 24th the Star Tribune published an opinion piece by Nekima Levy Armstrong, entitled “Research shows progressive places, like Minneapolis, have the worst achievement gaps.” In the piece, Levy Armstrong argues that racial achievement gaps are smaller in politically conservative cities, and that the public should demand progressive cities like Minneapolis to do better at closing those gaps. For empirical support, Levy Armstrong relies on a report by Brightbeam, a project of the school-reform oriented outlet Education Post. The Brightbeam report analyzes student performance gaps between racial groups in the most progressive and conservative large cities in the U.S.

Unquestionably, as in almost all American cities and regions, Minneapolis and the Twin Cities region are home to significant racial disparities, and these disparities are an important problem that policymakers should address. However, there are numerous substantive and methodological issues contained in the Brightbeam report. These problems cast serious doubt on the report’s conclusion that progressive cities are especially likely to produce gaps , or its suggestion that leaders in more conservative cities merit praise for tackling racial gaps.

The Brightbeam report, entitled “The Secret Shame,” is full of rhetorical claims based on results from a variety of unsound research practices. Most importantly, racial segregation is mentioned only once in the report and is not given consideration in the data analysis, an unacceptable omission given the body of research concluding that segregation is a driving factor in producing racial performance gaps.

The report bases its conclusions on analysis of two groups of 12 cities, one putatively consisting of the most progressive cities in the nation, and the other putatively consisting of the most conservative cities. It does not cite data sources or provide much of a methodological account of the research techniques it utilizes. While the report compares two groups containing a total of 24 cities, it fails to conduct analysis of the remainder of the universe of 67 cities described in the report, which show a range political policy preferences.

The report determines the political lean of each city by using surveys of policy preferences of city residents. However, at the outset, this poses serious methodological issues. First, cities and school districts are separate jurisdictions, and the policy preferences of city leaders may not mirror those of its associated district. Indeed, the survey used does not contain any question about schools or school policy, and instead focuses on respondent attitudes towards topics like the federal government.

An even more fundamental issue is that educational policymaking often does not occur at the city or district level. The governmental entities with the greatest control over questions of school policy are typically the state legislature and state department of education. Brightbeam makes no attempt to incorporate any measure of state policy or political lean, meaning that, in effect, the report assumes that city districts have singular and ultimate control over their schools.

But perhaps the most serious concern about the report’s measurement of citywide political opinion is that it assumes that each city is conterminous with its associated district. In reality, cities and school district boundaries often do not always overlap spatially. In fact, about half the cities listed in the survey are associated with school districts that either comprise a fraction of the municipality, or alternatively, include multiple municipalities and unincorporated areas. Importantly, these mismatches are more common in some parts of the country than others (for instance, in the south, districts are often countywide in scope). The report’s “conservative” cities are more likely to have boundary mismatches—6 of the 12 cities used for the report’s analysis of conservative cities have a major discrepancy.

To illustrate, Oklahoma City actually contains nineteen school districts within the city’s boundary, with the city district the most centrally located. The report offers no explanation of how it addressed these scenarios.

The report also appears to err in its use of school performance data. The authors of the report note that the data are derived by states and that the data between states are not strictly comparable to one another. However, unlike other researchers, Brightbeam has not attempted to standardize the results.

The Brightbeam report claims to control for other factors that might explain differences in gaps between progressive and conservative cities. These factors include student population size, and the racial demographics of the district. However, these are a far cry from all explanatory factors, and the report provides few details on how these controls were applied or why they were selected in the first place.

Here again, the Brightbeam analysis is partially limited by the fact that they have selected 12 of the “conservative” and “progressive” cities but do not include the full set of performance results for all the cities for which data exists.

By simply matching Brightbeam’s ‘conservatism’ scores to 2017-18 performance scores provided by The U.S. Department of Education, EdFacts, we are able to display the full range of performance scores in the 67 cities.

This shows that there is a great deal of variation in student performance and conservatism scores across city districts. For instance, chart 1 shows that there are large differences in the percentage of white and black students proficient in reading after sorting by the level of conservatism in the large cities. Clearly, there are wide racial gaps in the data. However, using the full data, it is much less clear how they relate to a city’s relative political conservatism.


Chart 2 shows the same data, but with test performance measured by white-black student racial gap ratios. We find that, generally speaking, as the conservatism score rises in a city, the racial gaps in student performance drops, but that the relationship between these variables is not strong, with a Pearson’s correlation coefficient of -0.32. There are progressive cities with small racial gaps (e.g. Detroit and New Orleans) and conservative cities with large racial gaps (e.g. Oklahoma City), weakening the correlation between ‘conservatism’ and racial gaps.


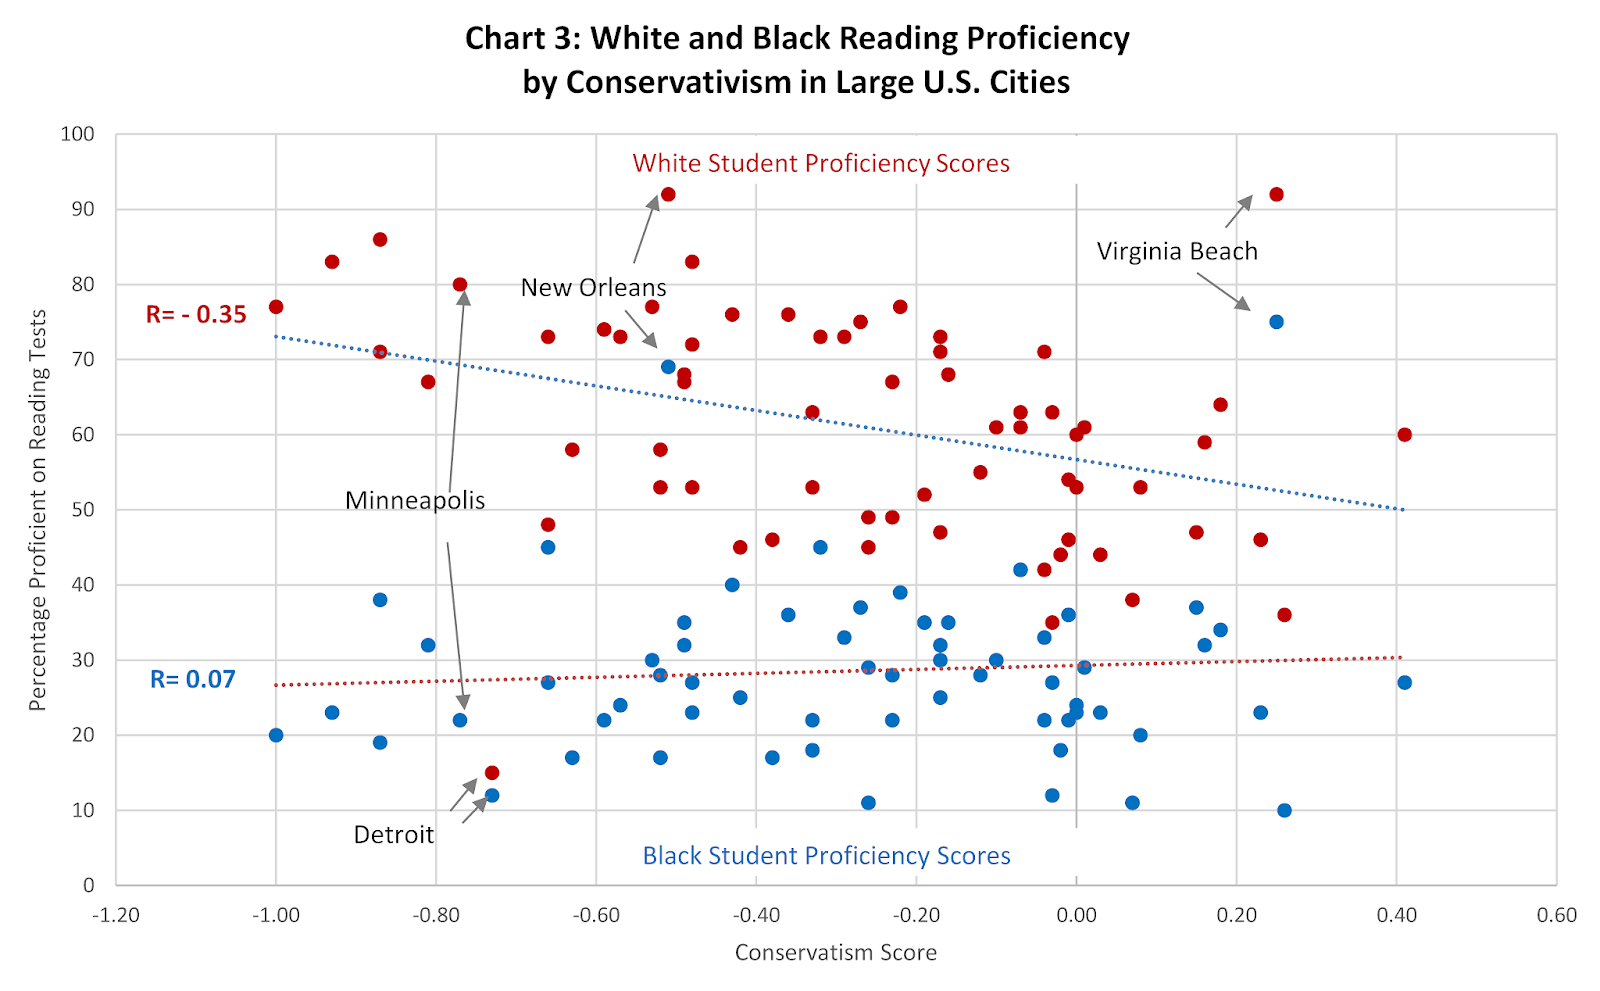
There is another important dynamic at play, as well. When breaking achievement gap data out into white and black student proficiency scores, we find that most of the difference between the cities’ racial gaps are due to decreasing white test performance scores in conservative-leaning cities, as shown on chart 3. There is a moderate correlation between white student reading performance and ‘conservatism’ in cities (R = -0.35), but practically no correlation at all when it comes to the performance of black students (R= 0.07).


We find quite similar results when comparing the 67 cities student performance in math, and when comparing the results between white and Hispanic students. Table 1 shows that all correlations between student proficiency and conservatism are weak to moderate (-0.28 to -0.36). Table 2 shows that there is virtually no relationship between black or Hispanic student performance and conservatism in cities. We also find this when limiting the data to the 24 cities reported and analyzed by Brightbeam, a finding not noted by the report’s authors.


Needless to say, this is not an overwhelming finding. Indeed, it suggests that conservative cities, far from being places to emulate, are simply providing uniformly mediocre education.

This is not to say that racial gaps in school performance are not a persistent issue, or that Minneapolis does not have large gaps. In fact, Minneapolis public schools have one of the largest white-black student performance gaps and socioeconomic segregation rates of school districts in the U.S., according to the Educational Opportunity Project at Stanford University. The Stanford project addressed this question with a full complement of standardized neighborhood, school and district data covering the entire nation. The researchers at Stanford find that the gaps can be linked to something that the Brightbeam authors neglect entirely: school segregation. The Stanford authors argue that to narrow such gaps, a reduction in segregation is necessary.

Unfortunately, the Brightbeam authors do not make any such policy recommendation. Their report simply suggests there is something magic in the water in conservatives cities, and use their report to laud the leaders of those cities while chiding progressive leaders. They offer no guidance for Minneapolis city leaders in the midst of important education decisions, such as the new Minneapolis Schools District Redesign plan.

We would argue that a more constructive stance is to perhaps disregard the superficial progressive-conservative divide altogether. Educational policy does not fit on a neat left-right spectrum, and some of the more progressive ideas about addressing segregation and racial gaps in schools come from more conservative-leaning areas, like Louisville, Kentucky, Raleigh, North Carolina and San Antonio, Texas. Putting the blame on progressive city leaders and residents also misses the mark, as segregation driven racial gaps are not limited to city boundaries. Instead they cut across city boundaries, metropolitan regions and political geographies. What is truly needed is a more serious and concerted effort by everyone to address them.

Friday, September 6, 2019

School Desegregation News Roundup: The lines that divide

The Institute on Metropolitan Opportunity is pleased to feature the School Desegregation News Roundup: periodic updates and reflections on educational desegregation and related issues, provided by Peter Piazza, an education policy researcher at Penn State's Center for Education and Civil Rights. Updates are crossposted on his site, available here

My last post was about the exchange between Kamala Harris and Joe Biden at the first round of Democratic primary debates earlier this summer. It’s amazing to me that this already feels so distant. Before getting to the main topic for the posts this week, here’s a quick summary of some of the major things that have happened in the last month or so: 
NYC also kept up an incredible pace of activity on school integration. The state Department of Education adopted new standards on culturally relevant-sustaining education, and the School Diversity Advisory Group released a new report urging the city scale back the use of admissions “screens” and to replace test-based “gifted and talented” programs with enrichment opportunities that are crafted at the local level. The new report has already attracted a lot of controversy. I’ve found these sources from Chalkbeat and the Daily News to be particularly helpful. And this edition of Voices in Urban Education has thoughtful commentary on school integration in NYC from folks actively involved on the ground. In addition to the links here, the upcoming newsletter from the National Coalition on School Diversity (sign up here) will have more on all of the above, including a list of great resources for anti-racist education. 
This post, meanwhile, focuses on local-level stories that may have been missed in the understandable frenzy caused by the other news this month. In particular, there were a lot of recent stories on potential changes to the invisible boundaries that divide students. Notably, Ed Build drew attention to the most egregiously inequitable district boundaries in the country. I’m referring, however, to boundaries on a smaller scale – the within-district decisions that can have a major positive impact on school integration, such as attendance zone changes or school mergers/pairings. (I was inspired by a recent conversation to use the term “pairing” as opposed to the less desirable “merger,” a framing that clearly favors the opponents of these sorts of school decisions.)
The cases outlined here join similar recent stories about attendance zone changes in Montgomery County, MD – where leaders recently requested a districtwide boundary analysis –  and a hopeful (though complicated) school pairing story in Chicago – where community activists helped create a rare Chicago school that doesn’t have a racial majority. This post covers Austin, TX, Wake County, NC, Sausalito and Oakland in CA, and Richmond, VA. 
Of course, changes to dividing lines inevitably inspire resistance from those who perceive that their privilege is threatened. As illustrated in the stories below, this resistance remains common and widespread.

These stories give disproportionate space to pushback from angry opposition, often from white parents. This is consistent with how desegregation efforts were covered roughly a half century ago (!) in the desegregation efforts of the 60’s and 70’s. Although parent opposition surely still exists, it’s not everything. Examples of parental and community support for integration have always existed as well, and they continue in the places highlighted in these posts, even if those efforts only get a few short lines in the news coverage.

And, as these stories also illustrate, there are also important positive developments, especially strong support for integration from district leaders. School district leaders are using their offices as a sort of bully pulpit to promote the benefits of school integration. This indeed is a long way from district administrators of the 1970’s who deliberately crafted chaotic desegregation plans in an effort to stoke public anger. Support from district leaders is still far too scarce, but it’s nonetheless a source of hope.
I’ve made an effort in the summaries to cover the most important details without getting too lengthy. If you have more info about any of the stories here or on similar efforts that haven’t gotten news coverage, please feel free to reach out on twitter or in comments. 
Austin, TX – Attendance zone changes and school pairings
Sadly, most of the substance in the Austin story is in the reaction more so than the integration plan itself. The district recently announced the potential for attendance zone changes and school pairings in response to declining student enrollment. Though specific zones/schools won’t be identified until September, the district has said that it wants to pursue equity in its decision making process. As detailed in this KUT story, the pushback is what you would expect:
  • “KUT obtained 450 anonymous responses parents submitted to the district about potential changes. The most common themes: Don’t disrupt the vertical teams students are already on (that is, the progression of elementary, middle and high schools assigned to a specific address); don’t close or change schools that are working; and don’t jeopardize property values.”
  • On parent, for example, argued: “Changing to Crockett would be very disappointing to us, detrimental to our children, and a blow to our house value/equity that we have worked hard to build.”
The district, however, is starkly segregated along racial and socio-economic lines, due to a combination of housing segregation and district policies, such as academic screens. Another KUT piece goes into detail on the history of integration efforts in Austin, which includes elaborate government and private business efforts to isolate Black neighborhoods and schools. Referring to the city’s 1928 Master Plan, the article notes:
  • “One of the main themes of the plan was how to get communities of color out of downtown – off land white residents wanted for themselves…They created a “negro district” in an area that is now east of I-35.”
  • “The “negro district” was located on what was considered undesirable land. Fast forward to the present day, and developers see this cheap land as an easy way to make money. They’re buying property up and fueling gentrification.”
After intervention from federal courts, the district implemented a two-way busing program from 1980-1987. As in so many other cities, after Austin was released from federal oversight, its integration effort largely ended, and schools rapidly resegregated. Parent complaints like those quoted above overlook the extent to which all communities are affected by this history, with some benefiting and others being further isolated. For example, one parent urges the city to “fix the problem schools in their areas and do not force families in great neighborhood schools to sacrifice when they don’t have a problem there.” In this great article from KUT, you can actually click through a slide show of all 450 anonymous comments. It also has lots of data on segregation in Austin as well as short videos from key experts, all part of their Dividing Lines series. 
Wake County, NC – Student enrollment targets
There’s been a lot of great reporting around school integration in Wake County, which includes Raleigh. I’m not sure this short blurb can do it justice, but the links have great info. Here are the key details, as reported in the Raleigh News Observer
  • “The school board gave tentative approval Tuesday (8/20) to a goal set by staff to move schools within range of the county average socioeconomically. This calls for switching to a system where every school would be assigned a score, based on Census data of their students, to determine their economic health.”
  • The Wake County Economic Health Index would rely on “Census data such as median household income, households receiving food stamps, whether rent and household mortgages are greater than 30% of income and how many people are living within 100 to 200% of the federal poverty level.” And, it would draw from the Census block level, not from individual students. 
  • “Staff also proposed a goal of getting elementary schools within 20 percentile points of the county average. It would be 15 points for middle schools and high schools. Currently, 26% of elementary schools, 37% of middle schools and 42% of high schools don’t meet that proposed target.”
  • Some of the potential changes: “looking at which schools could become magnet schools, whether before- and after-school care can be expanded and whether transportation changes should be made. The district will also look at how it can market itself as it faces competition from charter schools and home-schools.”
A recent Ed Week article has more details on the resulting segregation from charter expansion in Wake County: 
  • “There’s a fast-growing charter school sector that has proven attractive to white and affluent families. A 2015 study by researchers at Duke found that the statewide share of white students at charter schools was 62 percent in 2012, compared to 53 percent for white students at traditional public schools that year.”
  • “The five charter schools already open in that area have a student population that is more than 80 percent white and Asian… In contrast, the enrollment of the traditional public schools in that area is about 50 percent white and Asian students.”
District leaders estimate that it may take up to five years to reach their diversity targets. It is essentially the next chapter in a district that has a long history of push and pull in school integration efforts. That history was detailed in another News Observer article: 
  • “Wake County has historically been known as a leader in school integration. In 1976, the Wake County and Raleigh City school systems merged despite opposition from many in the community. Wake now has 160,000 students and is one of the largest districts in the country.”
  • “Wake tried to keep schools racially and later socioeconomically balanced, using a combination of student assignment and magnet schools. But in 2009, complaints about student assignment led to a new Republican school board majority that dialed back the diversity efforts.”
  • “Democrats regained the board majority in 2011 but the district still buses fewer students for diversity than it did a decade ago.”
As in the other cities highlighted in the post this week, there’s an important theme: district leaders’ strong stated commitment to integration, despite countervailing forces. Some may remember that the district used a snow day announcement last year to emphasize the importance of school integration. Notably, the school board also recently adopted the statement that “resegregation will not happen on our watch.”
Sausalito, CA – DOJ investigation and school pairing
In the second round of Democratic primary debates, Joe Biden criticized Kamala Harris for not pursuing any school integration cases when she was the attorney general of California. For one thing, it’s extremely rare for a state attorney general to do this. But, more to the point- her office did actually start a case in Sausalito Marin City, and that just recently came to a conclusion. (I’ve been surprised that the Harris campaign hasn’t been more vocal in taking credit for this.)
This New York Times story has key details on the case. In particular, the state’s Justice Department found that the segregation between a charter school in a white enclave and a nearby (and overwhelmingly Black and Latinx) public school violated the equal protection clause of the state constitution. The investigation uncovered clear evidence of intentional racial discrimination: 
  • “At a district meeting in 2012, a district trustee, who is not named in court papers, “admitted that the plan to create separate programs for Sausalito and Marin City was motivated by a desire to create separate programs for separate communities,” according to the complaint. “This trustee also expressed it would improve community relations if students in Marin City were not ‘shipped over’ to Sausalito.””
  • “In court papers, the attorney general said that the district had systematically starved the school it ran of resources.” This short radio piece claims that the former school board “terminated math, science and reading programs at the school which primarily serves students of color.”
The settlement establishes a committee of students, parents, teachers and community leaders to help craft a desegregation plan and the two schools have each passed resolutions to explore a pairing. The radio piece also has a bit about parent reaction, which includes this common refrain of integration opponents: “we’re doing something right and we just keep getting penalized for it.”
Oakland – School pairing
Across the bay, the school board in Oakland recently announced a plan to pair two elementary schools. Many of the themes resonate with the stories across these two posts. As noted in this KQED story
  • “Kaiser (39% Black and Latinx) and Sankofa (79%) are only about three miles away from each other, but in many respects the two schools are leagues apart.” At Sankofa, only 4% met state math standards last year and it was less than 8% for ELA. 
  • An example parent comment: “To merge Kaiser with any school and rip that fabric apart brings up a mix of real deep sorrow and loss, and then anger turning to creativity about how we’re not going to allow that to happen.”
Though, there is one difference from the other stories- a literal ticket out for families opposed to the pairing:
  • “According to the district, Kaiser parents who don’t want to send their kids to the merged school may be able to take advantage of a policy being considered by the school board — what’s being called an “opportunity ticket” that would give them priority enrollment at a school of their choice.”
Baltimore area – Attendance zone changes
This story, though new and less-covered, also echoes the theme of support for integration among district leaders. Specifically, three County Council members signed a letter asking the superintendent to “comprehensively address the socioeconomic and racial segregation in Howard County Public Schools through a meaningful redistricting process.” They charged that: 
  • “Currently school district boundaries in Howard County are drawn in a manner that concentrate students participating in the Free and Reduced Meals program [FARMS] into certain elementary, middle, and high schools.”
Charleston – School pairings
The Charleston County School Board will soon vote on a number of proposals that are designed “to integrate and end racial disparities at its mostly black and underperforming schools.” Among the recommendations is a pairing similar to those described across this roundup. And, like the cities highlighted here, the district has come out strongly in favor of school integration. As noted in this article:
  • In a recent and blunt video message to the community, Charleston schools Superintendent Gerrita Postlewait said: “There are far too many children, particularly of color and poverty, who have been disserved by the system. … We have to have the courage and the will to do something about it.”
Richmond, VA – Attendance zone changes and school pairing
Last June, Richmond released a draft of changes to school attendance zones that also included pairing a majority Black elementary school with a majority white school less than two miles away. Subsequent plans have included even more pairing options. This article has a great discussion of the history leading up to the changes informed by Genevieve Siegel-Hawley, a Virginia Commonwealth University professor who’s published a lot on school integration efforts and has a great piece on benefits for white students.
A school rezoning committee composed of community stakeholders worked hard to push the district to pursue school pairing options as a way to increase school diversity. The city is expecting to receive a cost estimate for the rezoning/pairing plan by the end of September, and the school board is expected to vote on the plan by the end of the calendar year.    
District leaders have supported the committee’s work, despite pushback from parents. As noted in the article, parents submitted anonymous comments on the merger proposal (known as option 2): 
  • Some parents were forceful in anonymous written comments submitted to the school system, which included threats to leave the school district: “If option 2 is passed, I know that I, along with many other neighbors, would carefully weigh the decision of whether to send my children to private school or to move out of the district for a better elementary school option for our family.”
A related piece from Kimberly Bridges, also a professor a Virginia Commonwealth University and former Richmond school board chair, looks at the history of parental reaction to similar decisions in Richmond and elsewhere. In the piece, she points out a too-often untold story: after a 2013 rezoning effort that led to increased segregation, many parents came out in favor of school integration and have since been active on this issue. 
Kimberly calls for massive persistence in the face of what superintendent Jason Kamras has termed Massive Resistance 2.0. Like many of the other district leaders in the posts this week, Kamras has made it a point to forcefully support integration in his response to parents:   
  • “It is fair to make critiques of the proposal but what is not fair from my perspective is critiques that are masquerading as critiques when they’re really resisting the ultimate goal, which is integration.”
In addition, neighboring Henrico County is also in the process of adjusting its attendance zones. As Kimberly highlights here, that district is segregated from east to west according to race and socio-economic status. Although Henrico county doesn’t include Richmond, it is very much connected to the city’s racial history. Part of a trend in suburban school segregation, Henrico does include first-ring Richmond suburbs that are rapidly diversifying and, in the process, raising challenges related to racial equity in the county’s schools. 
I emailed Kimberly about this, and her summary sheds light on the part of the story often left out of media coverage: “While the ongoing patterns are frustrating to observe, I’m also encouraged by voices on the other side. I see growth in Richmond in terms of support for diverse schools and understanding of our systemic and historical challenges related to racial segregation.” (It was also the conversation with Kimberly that encouraged me to use the term “school pairing” instead of “school merger.”)
Supporters and grassroots activists for integration are out there, and their numbers are growing. It’s well past time for the media coverage to move beyond a framing that is many decades old and to make room for more hopeful stories of those who are working for school integration.

I’ll continue to track updates on these stories. If you have updates/comments about any of these districts or updates on any places not featured in the post this week, please feel free to use comments below or reach out on twitter.

Wednesday, April 10, 2019

A Survey of Gentrification and Decline: Our Report on American Neighborhood Change

We're very pleased to announce the completion of American Neighborhood Change in the 21st Century, a significant project we've been working on for many months. It's a new study of the ways American cities and regions have evolved since 2000, designed to capture, in unprecedented detail, the process of growth, decline, displacement, and poverty concentration across the nation. The study is available on the Institute on Metropolitan Opportunity website.

The study categorizes all US census tracts by the changes they underwent between 2000 and 2016. The report develops and utilizes a four-dimensional model of neighborhood change, which differentiates between overall growth, low-income displacement, low-income concentration, or abandonment. This spectrum of neighborhood change was devised to solve a problem faced by some other studies: the tendency to analyze neighborhood decline or gentrification in isolation, and in the process ignore the relative prevalence of each. As a result, while researchers could suggest a particular area was gentrifying or declining, it was difficult to resolve debates about which type of change was a bigger problem, and where.

Our new study also corrects a major shortcoming of some prior research into neighborhood change, which is the tendency to artificially omit many geographic areas from analysis, either because they are initially deemed "ungentrifiable" or because they fall outside central city borders. Housing markets and population flows do not stop at city borders, and middle-class areas as well as poor areas are constantly facing pressure to change. By considering all tracts eligible for change regardless of location or jurisdiction, we hope our study can provide the holistic view some previous efforts have lacked.

Chart 1, from the report, neatly summarizes those holistic findings (click to enlarge):


As the chart suggests, the study reveals that dramatically more Americans live in areas experiencing low-income concentration than any other form of neighborhood change--and most of those residents live in the suburbs. Low-income displacement, a hallmark of gentrification, is the next most common type of change. A relatively small number of people live in areas experiencing outright abandonment across the income spectrum, although these areas represent some of the most trouble neighborhoods in America.

Other findings from the 50 largest metropolitan areas include:

  • At the metropolitan level, low-income residents are invariably exposed to neighborhood decline more than gentrification. As of 2016, there was no metropolitan region in the nation where a low-income person was more likely to live in an economically expanding neighborhood than an economically declining neighborhood.
  • Low-income displacement is the predominant trend in a limited set of central cities, primarily located on the eastern and western coasts. Los Angeles and Washington, D.C. have the most widespread displacement.
  • On net, far fewer low-income residents are affected by displacement than concentration. Since 2000, the low-income population of economically expanding areas has fallen by 464,000, while the low-income population of economically declining areas has grown 5,369,000.
  • White flight corresponds strongly with neighborhood change. Between 2000 and 2016, the white population of economically expanding areas grew by 44 percent. In declining areas, white population fell by 22 percent over the same span.
  • Nonwhite residents are far more likely to live in economically declining areas. In 2016, nearly 35 percent of black residents lived in economically declining areas, while 9 percent lived in economically expanding areas.

Table 3 from the report, below, shows the population exposure to different kinds of neighborhood change across different metropolitan areas (click to enlarge):


As the table suggests, low-income concentration is commonplace in most metros and the overwhelming trend in many. Declining industrial regions like Detroit or Cleveland the show largest amount of concentration. By contrast, only a few regions have a larger share of overall population living in areas with growth or low-income displacement than in areas with decline.

These findings only scrape the surface of the study. The full study includes a plethora of resources for analyzing neighborhood change, designed to be easily interpreted by policymakers and residents alike. These include an interactive national map of low-income displacement and concentration, detailed tabulations of the effects of neighborhood change on over 20 demographic subgroups, and individual reports tabulating and mapping types of neighborhood change for each of the 50 largest metropolitan areas. We're particularly proud of these regional maps, which we feel are highly informative and easy to read.


We'll be writing up many of the report's other findings over the coming days and weeks, but for now, we'd love for you to peruse the these findings yourself at https://www.law.umn.edu/institute-metropolitan-opportunity/gentrification

Wednesday, April 3, 2019

Summit for Civil Rights to Tackle Racial Justice, Economic Equality at Rutgers University

Congressional leadership, major labor leaders, and some of the United States’ top legal and social science thinkers will come together at Rutgers University in New Brunswick, New Jersey on May 2 and 3 to help rebuild a national movement to defeat segregation, promote racial justice, and provide economic equality. Leaders and advocates for civil rights, labor rights, and economic fairness are invited to join. 

The 2nd annual Summit for Civil Rights comes at a difficult political moment for the civil rights community, when its values are being forgotten in institutions such as the federal Department of Justice and the U.S. Supreme Court. This national Summit is intended to reverse this narrative of defeat and decline, and explore the ways in which this dark political moment is in fact a time of immense social opportunity for racial and social justice, rooted in unexpected places. Growing diversity, particularly in the suburbs that elect a majority of the nation’s political leadership, has made the politics civil rights viable once again. In these places, an unrecognized and untapped coalition is forming, one that could reshape America.

The time and place of the Summit were chosen to take advantage of two major developments in civil rights: the advancement of two major statewide school desegregation lawsuits -- one in New Jersey and the other in Minnesota. At a time when the federal government has often been unfavorable to concerns about segregation, these pioneering lawsuits seek to use state constitutions to require state legislatures to pursue the long-delayed objective of school integration. In both states, this legislative and legal activity has given rise to opportunities for local and community organizing. 

The Summit seeks to leverage these developments to expand its diverse, multiracial coalition. That coalition will work to interweave school integration remedies into efforts to create housing justice and economic opportunity.

The first Summit for Civil Rights, held in Minneapolis, Minnesota in November 2017, was a significant success. It brought together civil rights leaders including then-Rep. Keith Ellison, Rep. James E. Clyburn, and former U.S. Vice President Walter Mondale to formulate the principles of a state-by-state strategy for racial and economic opportunity. That strategy included legal, legislative, and community organizing components, all of which are reflected in the Minnesota and New Jersey proceedings.

In New Jersey, Summit leaders and other experts will grapple with the political, economic and policy implications of these school desegregation lawsuits. They will consider the role diverse school districts might play in advancing broader civil rights objectives. Local practitioners, local and national activists, and others are welcome to attend. Prominent elected officials and civil rights leaders currently slated to attend include:

  • Rep. James E. Clyburn
  • Rep. Sheila Jackson Lee
  • Rep. Bonnie Watson Coleman
  • Rep. Frank Pallone
  • Minnesota Attorney General Keith Ellison
  • New Jersey Sen. Nia H. Gill
  • Atlantic City Freeholder Ashley Bennett
  • Rev. Cornell Brooks
  • NAACP President Derrick Johnson
  • NEA Vice President Becky Pringle
  • Prof. Diane Ravitch
In addition, speakers will include over two dozen other top labor, faith, political, and intellectual leaders. For more information about speakers, please visit the Summit for Civil Rights website. Registration is available here
WHERE: Labor Center at Rutgers University, 50 Labor Center Way, New Brunswick, N.J.
WHEN: Starts Thursday, May 2 at 1:00 p.m. (welcome reception and recognition ceremony for Rep. James E. Clyburn starts at 6:00 p.m.); Summit concludes Friday, May 3 at 4:00 p.m.
The Summit for Civil Rights is presented by the Institute on Metropolitan Opportunity, the Labor Education Action Research Network at Rutgers, the Coalition of Black Trade Unionists, and Building One America, with support from the Ford Foundation and the UAW. For more details about the event, please visit the Summit website, https://summitforcivilrights.orghttps://summitforcivilrights.org/.

CONTACTS:
  • Myron Orfield, Institute on Metropolitan Opportunity Director, orfield@umn.edu, 612-625-7976
  • Will Stancil, Institute on Metropolitan Opportunity Fellow, stanc047@umn.edu, 612-624-8329


SD News Roundup, Part 1: The big admissions stories

The Institute on Metropolitan Opportunity is pleased to feature the School Desegregation News Roundup: periodic updates and reflections on educational desegregation and related issues, provided by Peter Piazza, an education policy researcher at Penn State's Center for Education and Civil Rights. Updates are crossposted on his site, available here

It’d be impossible to write a school diversity news roundup for March 2019 without talking about two major stories. On March 12th, we learned about an elaborate bribery scheme that wealthy white parents used as “a side door” into America’s most elite colleges. And, less than a week later, the New York Times wrote a story about appallingly low admission rates for Black and Latinx students in NYC’s elite high schools. A commonly cited example: in the city’s most selective school, Stuyvesant High School, only 7 Black students were admitted for the upcoming fall, out of 895 spots.  
It’s rare for school diversity to make mainstream news, but these stories are apparently shocking enough to be exceptions. (I even found the NYC high school story on Fox News, of all places.) When major outlets pick up this topic, it often has mixed results at best. In this case, understandable outrage over a small number of schools/universities can soak up a disproportionate amount of public attention, ultimately obscuring the many, more subtle and daily ways that racial injustice plays out in education. 
Nonetheless, when covered well, bald injustice like this at least has the potential to reach a broader audience and hopefully inspire greater awareness/debate etc about common school diversity issues. Especially because they came out so close together, these cases combined to illustrate themes that animate many lesser known stories- that, in the name of meritocracy, the system is thoroughly stacked against low-income Black and Latinx students; yet, at the same time, white people enjoy privileges that expose meritocracy as meaningless, invented and even laughable. 
In this post, then, I wanted to highlight a few great pieces that indeed used these stories to talk about broader social and/or historical issues that maintain racial injustice in education. That’s part 1 of the roundup. In part 2, I’ll talk about a topic that may have been lost altogether in the news last month. In particular, there have been a few great op-eds lately, written by white parents in defense of diverse schools. I’ll write about these pieces in light of new research on how white parents make decisions about where to send their kids to school. So, stay tuned! For now, here’s my favorite coverage from the big stories:
College Admissions Scandal
  • “Ignorance Was Bliss for the Children of the College-Admissions Scandal,” by Will Stancil in the Atlantic. Will compares the blatant unfairness of the college admissions scandal with the many, small, daily ways that white people receive unearned benefits. The piece calls for white people to try to become more aware for their unearned privileges and, ultimately, it questions “whether the real fraud is the idea of merit in the first place—that maybe ‘deservingness’ is a shoddy basis for organizing a society altogether.”
  • “Operation Varsity Blues is Just Another Tiki Torch,” by Courtney Everts Mykytyn at IntegratedSchools.org. Similar theme here, as Courtney’s piece calls attention to the more subtle ways that white privilege shapes opportunity for some while foreclosing opportunity for others. In my favorite line from the post, she observes that “while we shame the celebrities who got pinched, we look away from the routine ways that opportunities are hoarded in our pubic ed system. We love the egregious for giving us cover from the everyday.”
NYC High School Inequity
First, in case you missed this one, here’s a few key details from the original story:
  • NYC has eight specialized high schools, and admission to these schools is based exclusively on the scores from a single exam, the Specialized High School Admissions Test (SHSAT). As many articles pointed out, these are the only specialized high schools in the country that use only a single criterion for admissions- imagine, for a second, that there was an elite public university in the country, where tuition was free, and it only used the SAT to decide who gets in.
  • Admissions letters for these 8 schools went out in March, and the rates for Black and Latinx students were indeed appalling. Overall, only 190 Black students were admitted across the 8 schools, which encompasses 4,800 seats. As noted above, only 7 Black students were admitted to Stuyvesant High School; that number was only slightly better at 33 for Latinx students. The original story has a great graphic breakdown of admission by race at each school.
A lot of news outlets covered this story. In their recent newsletter, the National Coalition on School Diversity has a good list of stories for anyone who wants to dive in further. For now, I want to use my list to highlight a few perspectives/topics that were missing from the broader coverage:
  • “NYC High School Admissions Creates Winners And Losers. I Lost.” by Muhammed Deen in the Gothamist. This was one of only a very few pieces that features a student’s perspective on the admissions system/process. It was written by a NYC high school grad who is now a freshman at Hunter College. He talks about his experience navigating the complicated high school selection process as an eighth grader and describes the inequities at his high school: “We weren’t allowed to take textbooks home. Our calculators rarely worked. I could not exit the building for lunch due to my school’s metal detector.” The author is an organizer with Teens Take Charge, which just launched an Enrollment Equity Campaign that spans all 450 public high schools in NYC. You can learn more about the group/campaign in this short video or by searching for #IntegrateNOW on twitter.
  • “The New York City school controversy shows why standardized testing is broken,” by Jose Vilson at Vox.com. Written by an NYC teacher and public education advocate, this piece describes how teachers and their students are affected by the rejection letters. The author notes that “I’ve had to console far too many brilliant students who didn’t get chosen for the high school they wanted to go to. They checked off all the proverbial boxes: great attendance, high grades, strong work ethic, and had positive relationships with adults and peers.” But “because a student’s score on that test is the only criterion for high school admissions, the stressful three hours spent taking this exam could determine a student’s future.” This article also makes an important point about the policy that established the SHSAT, which was set by state law (!), not by the city. Nearly every article notes that it will require a change in state law, then, to adjust admissions policies for these schools. However, the discussion almost always ends there, potentially leaving readers with the impression this is just a random/quirky thing that makes the process more complicated. Instead, this article connects the reliance on standardized assessment to the use of IQ tests as “a tool for pundits to argue that people of darker skins were intellectually inferior.” The author notes that the 1971 law – known as Hecht-Calandra – was itself a debate about race and enrollment.
  • “Segregation Has Been the Story of New York City’s Schools for 50 Years,” by Eliza Shapiro in the New York Times. This is a historical look at segregation in NYC, written by the author of the original story about admissions rates. There’s a lot of great stuff in the article, but I want to focus on the background for Hecht-Calandra. As described also in this short podcast, race was central to the debate over the bill. Then, as now, “critics said the exam was ‘culturally biased’ and discriminatory against black and Hispanic students” and supporters of the test argued that the specialized schools “could be saved only if, once and for all, it is established that there can be no tampering with the standards of merit and achievement that have been the basis for admission.”
  • “Assembly Votes High School Curb,” by Francis X. Clines in the New York Times on May 20, 1971. If you have any lingering doubts about the role of race in Hecht-Calandra law, check out the New York Times archive from when the law was passed. It was ugly and sad. At the time, NYC’s mayor and chancellor seemed willing to reconsider the use of the exam. Specifically, when the schools chancellor merely initiated a study to look into whether the specialized high schools “‘were ‘culturally biased’ against blacks and Puerto Ricans,” supporters of the exam bypassed the city and went to Albany where they found “a white cross-section of Democrats, Republicans, Conservatives and Liberals” to sponsor and pass the bill. 
  • During the debate, opponents of the bill challenged their colleagues in the legislature for “joining the racist conservatives” while others gestured back directly, saying they were “offended and deeply hurt” by the suggestion. After the vote, mostly everyone left the chamber, except a Black lawmaker from Buffalo who lamented that “I thought by coming here I would make some minimal change,” before sitting down with tears in his eyes. Even more heartbreaking, the law has worked exactly as opponents feared. Here’s a table from the 1971 coverage (written in the race/ethnicity categories of that time). As pointed out by Eliza Shapiro, “Stuyvesant was 10.3 percent black then; now it is 0.8 percent black.”
Meanwhile, wealthy folks have been buying their way into elite colleges. While we scoff at the excess, we accept the more common/subtle privileges as natural even when they’ve grown, over time, to become absurd. At the very least, folks who write stories about NYC’s specialized high schools should talk about the history here, and supporters of entrance exams should have to somehow address or respond to it. 
Again, however, despite the egregiousness here, it’s important to remember that any policy changes to NYC’s specialized high schools will only affect the 8 schools. It’s undoubtedly important, but it shouldn’t overshadow other important school diversity efforts in NYC and the larger struggle for school diversity across the country. True of the big stories and the comparatively smaller ones- broader change will come when white people begin to see the value of school diversity for their children, other children and society on the whole, and when they begin to act on it. In an effort to be more hopeful/uplifting, I’ll focus on those efforts in part 2 of the roundup next week.